A normal website has many ways to be hacked: Manage to get a hold of a username and a password, have access to their database, etc. But there are simpler ways to attack a website with just your browser and a set of in-built tools.
Let’s see how can start attacking websites for the first time in our #FromZeroToHacker challenge.
| Table of contents |
| Introduction |
| What I have learnt today? |
| Stats |
| Resources |
Introduction to Checking under the hood of a website
When we see a hacker on a flick, there is somebody in a black sweatshirt with a hood, typing fast in a black terminal. While that sometimes may be the truth (you really spend more time reading code than typing anything), you should start hacking a website by reading the code.
Any mistake: A piece of non-used code left, a JavaScript code not obscured, leaving the structure of files wide open to all to see, etc, can be a vector of attack.
And today we are going to see how can we check under the hood of a website by reading the source code.

What I have learnt today?
Walking an application
Intro
In this section we will learn how to manually review a web application, looking for security holes using only the in-built tools in our browser:
- View Source: Using our browser to view the source code of a website
- Inspector: Know how to inspect page elements and make changes to view usually blocked content
- Debugger: Inspect and control the flow of a page’s JavaScript
- Network: See all the network requests a page makes
Exploring the website
We can review a website or web application in order to find potential vulnerabilities (Usually, parts that require some interactivity with the user) to exploit.
A good place to start is with just your browser, exploring the website code, and noting down the individual parts of it that may be vulnerable.
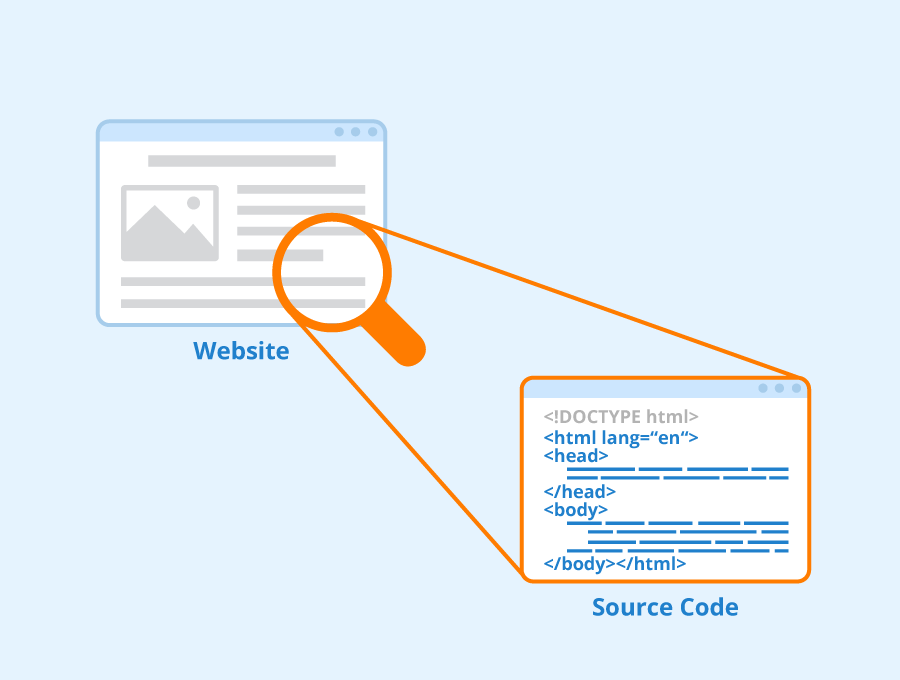
Viewing the page source
The page source is the readable code returned to our browser. It is made up of HTML (the structure), CSS (style), and sometimes, JavaScript (Interactivity).
Viewing the page source can help us discover vulnerabilities and interesting information about the web application.
You can view it by right-clicking the page and selecting the ‘Inspect’/’View Page Source’ option.
What we can find in it?
There is a lot of what we can find in the source code of a website, so enumerating everything would be out of the scope of a simple blog post, but I’ll list the most common stuff you can find in them.
Sometimes, there is code between <-- and -->. These are comments: A text left by developers that won’t be run as code. Sometimes is just text to remind us about something, sometimes is just old code that we want to keep.

A link is specified with the <a> tag, and where it redirects is pointed on the href= attribute.
External files such as CSS, JavaScript, and Images can be included using the HTML code.

It may not seem like the hackers you see on TV, but reading carefully the code can give you some great insight into how the website works. And how many holes did they put there where you can poke at 🙂
Developer tools
Every modern web browser contains developer tools, a tool kit used to help web developers. As a pentester, we can use these tools too to provide us with a better understanding of the web application and how it works.
We will focus on three features of the developer tool kit: Inspector, Debugger, and Network.
You can open the developer tools by right-clicking the page and selecting the Inspector option (Or Control + Shift + I in Firefox and Chrome).
Inspector
As we saw a moment ago, the page source is a great source (hehe) of information about how the website works. The interaction between HTML and CSS (and, sometimes, JavaScript) makes what we see in the browser, but in the Inspector section, we can see an X-Ray vision of the website.
But not only we can see, but we can also edit and interact with the page elements.
For example, do you know about paywalls? These pesky things block you from reading the content of the website unless you pay for it. Paywalls normally use a combination of CSS and JavaScript to block the content until you pay for it.
But as with everything on the internet, it can be manipulated.
Let’s take this for example:

We can see the article behind the paywall if only we had a way to remove it!
But we do… Let’s right-click the paywall and Inspect it:

The <div> tag contains the whole paywall, and has the class premium-customer-blocker in it. This class gives a lot of CSS instructions for the paywall (position, colour, size…) and the dreaded display: block, that displays the paywall.
If we change the display value to display: none, we can read now the text!

As you can see, manipulating the values and interacting with the code lets us get more information than we can as a ‘normal user’.
This may seem like a poor example of what we can do within the inspector section but believe me. It works. Even big-name newspapers. Try it if you want 🙂
Debugger
The third tab on the Developer Tools is Sources, where we can debug JavaScript code. A great way to find out why your JavaScript is not working. And a great way to manipulate it for our interest.

At the left-hand side, there is a list of all the resources the current page is using. By right-clicking on them, you can read the code.

Sometimes, the code is compressed, or minimised, and everything is on one long line. We can format this code with the {} tool, called Pretty print, that makes everything human-readable.
We can also use breakpoints: These are breaks in the code where we force the browser to stop processing the JavaScript, pausing it for us.

Network
On the fourth tab, Network, we can keep track of every request and resource a website required.
Open this tab and refresh a webpage: You’ll see everything required by the website:

This can let us find hidden resources, URLs pointing to internal folders, and a lot of information about the website.
The Dev Tools is a great way to find out information about the website: Sometimes login credentials are hidden in a comment on the source code, hidden folders that give us access to assets, and learning how the JavaScript works.
Reviewing this is one of the first steps in attacking a website.
Stats
From 191.218th to 186.990th. Top 9% in TryHackMe!
Here is also the Skill Matrix:


